A bug which should have been solved a week ago
Recently, we have a DS ticket that said a user got banner error periodically on the home page. That means we got some BE errors on API requests. I checked NewRelic and nothing exception was found. I checked error logs on our server and only a few 500 errors. I can’t find further information about these errors. So I believe it was caused by an unstable network or it might be caused. I was not working on that task.
Until yesterday we were going to solve a cache memory issue and I still not realized that was caused by cache memory. After I had submitted that PR of fixing cache memory, I decided to look that DS ticket again. I notice there’s some clue. I could find banner errors on fullstory and that means we did get some request errors. Then I checked request logs on Cloudflare and here are unsuccessful requests.
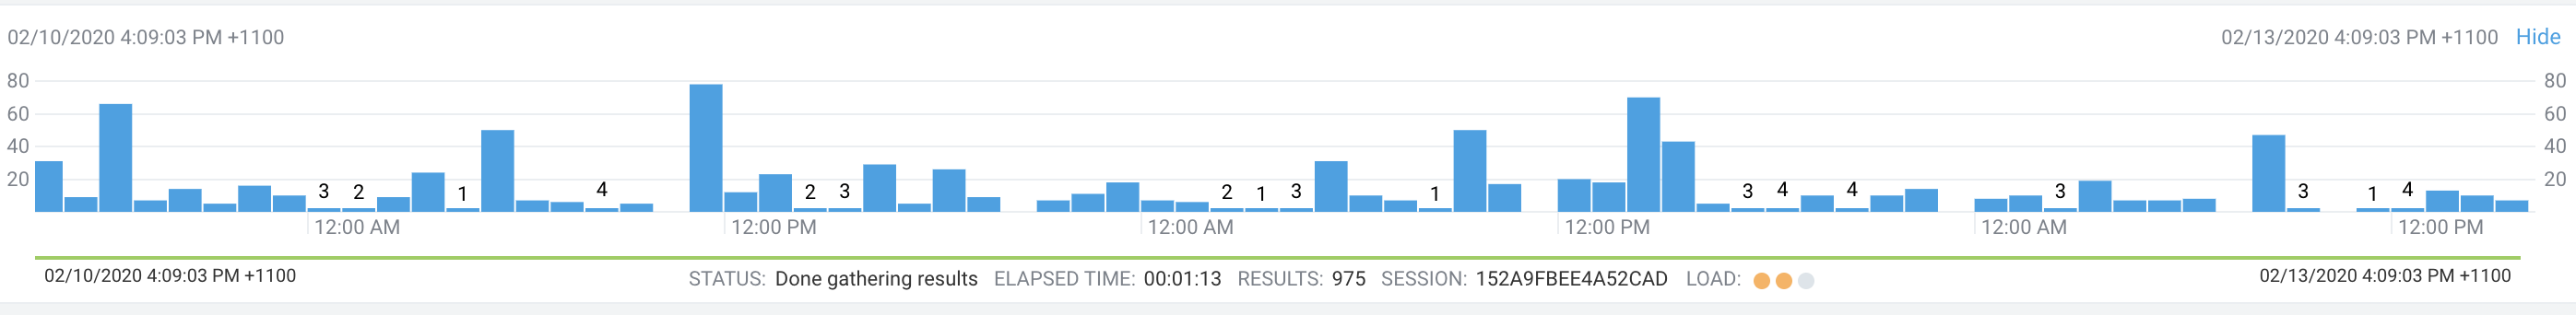
We should notice that not all the unsuccessful requests matter because some of them are from scanners and attackers. If we look into the intensive bar, we notice that most of the errors are 5** error. We got this error probably because of the unavailable server. Let’s take a look at all 502 errors.
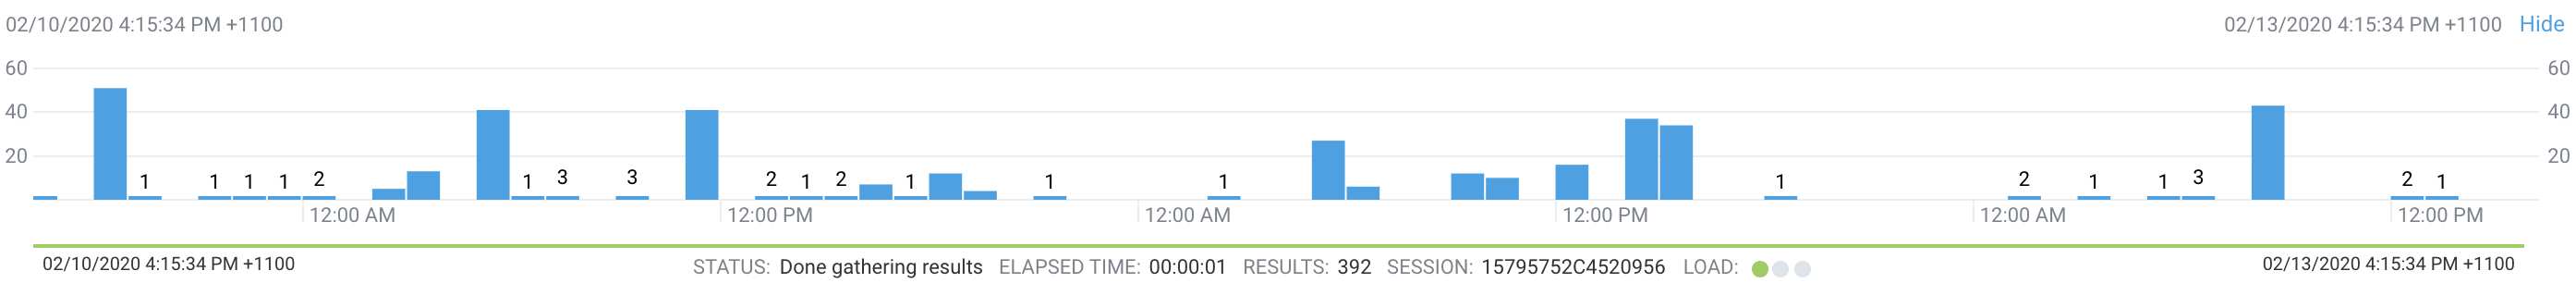
Then I notice that the chart is highly correlated to our server up-down.
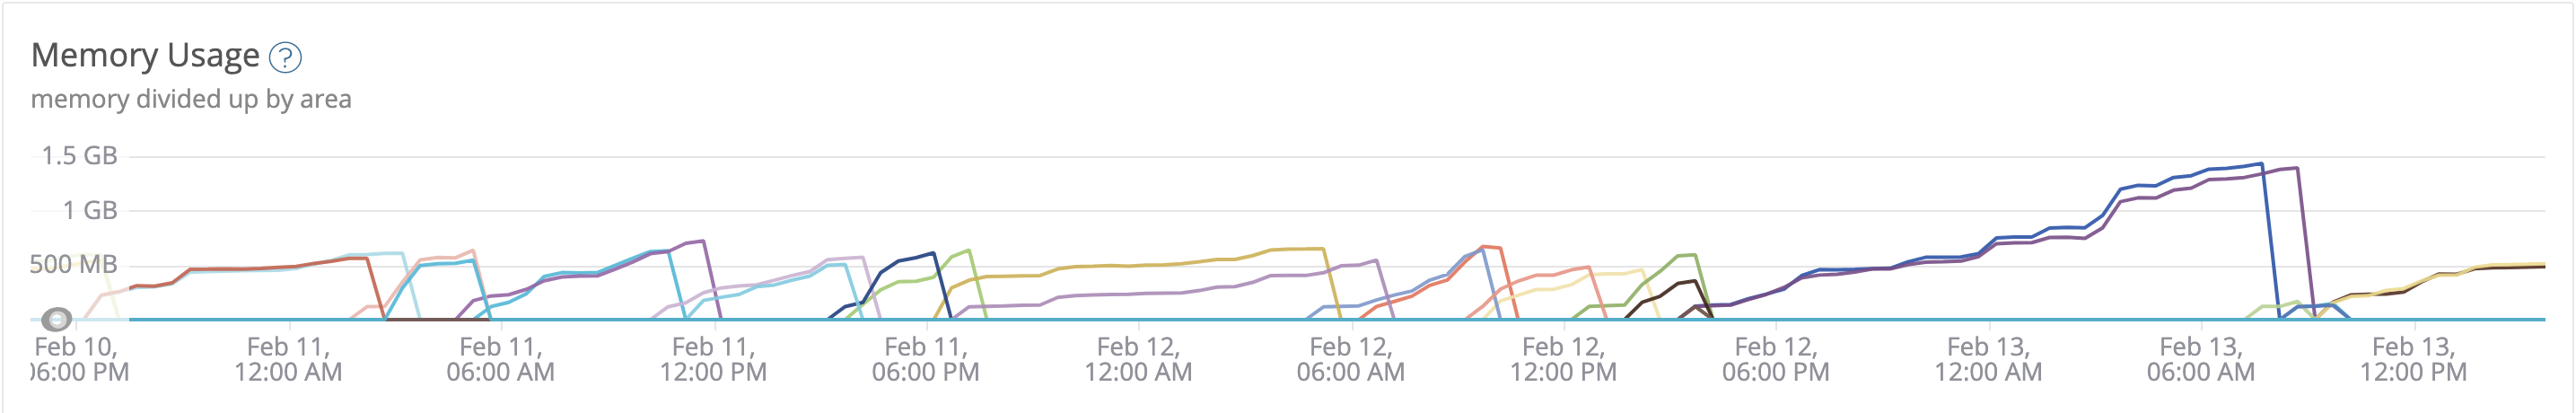
So, That errors must be caused by the memory issue.
Basically, we’re caching the requests to microservices. The problem is the cache instance is infinite by default. https://github.com/apollographql/apollo-server/issues/2252
Misunderstand about zero downtime
As we might know when we’re deploying a new update. A new docker image will be created and we start up 2 new instances. Then the load balancer will refer to the new instances once they are healthy. Then it’s safe for us to delete the old instances.
I didn’t take it seriously when I saw the containers were down and up. As I thought it should be looked after by AWS agents and we won’t have downtime. When I looked at the chart, I was further convinced. Look, before the old container is down, a new container is already up. It’s awesome!
Unfortunately, we still got 502 errors. But Why? 🤔
The reason is we were not closing the old container deliberately. The old container dead of using out of memory. During that time(might be a few seconds), the request was assigned to that old container.
Self Review
I didn’t know that the max size is infinite in the beginning. I did find that memory was increasing a few weeks ago but I didn’t take it seriously as the misunderstanding I mentioned above.
I could do better is to solve it immediately. Two things to help to debug: Talk to the people who report that bug; Check everything in that task.
Some tips of troubleshooting
The most important thing to debug is to restore the error. If we could reproduce it, usually it’s easy to fix it. Basically, it’s hard to debug occasional errors. Once we know some user info, we could check fullstory and see the original errors. Once we know the accurate time, we could check all the logs during that period.
The last critical thing from this lesson is prepare it beforehand. Before any alerts are triggered, we’d better understand what normal error we have.
In the next few days, I get to watch the error logs of Cloudflare, Newrelic and ensure I understand every error.